About
OBIEE does not support cross column conditional formatting in Pivot view. For instance, it's not possible to set a red background of a column based on the value of an other column.
Below is a workaround to be able to perform this kind of formatting and the principal idea is to transform a table view as a pivot table.
Articles Related
Example Data Set
Example : I want to pivot this table from the SH schema :
| Promo Category | Channel Desc | Amount Sold |
|---|---|---|
| internet | Direct Sales | 2,658,953 |
| internet | Internet | 642,251 |
| internet | Partners | 1,097,558 |
| NO PROMOTION | Direct Sales | 115,549,450 |
| NO PROMOTION | Internet | 26,154,910 |
| NO PROMOTION | Partners | 51,682,188 |
| post | Tele Sales | 554,853 |
| TV | Direct Sales | 696,703 |
| TV | Internet | 4,166 |
If the pivot column is the column “Channel Desc”, we have 5 distinct values :
Direct Sales
Internet
Partners
Tele Sales
We create therefore 6 columns :
- one for the “Promo Category”
- 4 formula columns for each distinct value of the “Channel Desc”
- one for the cross conditional formatting
How to transform a table in a pivot
All the details are here :
Conditional Formatting
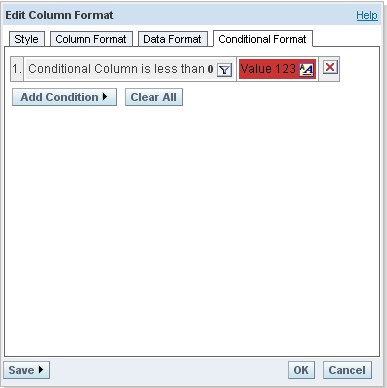
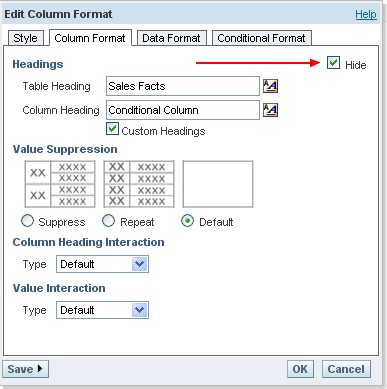
After having transformed our table in a pivot, it's finally possible to apply a formatting and to hide the conditional column.
The Result
This method has a weak point is that you must know the number of distinct value in advance. For instance, if a new distinct value appear in the column “Channel Desc”, you must change your report.
To resolve this issue, you can also achieve a pivot statement with a stored procedure or wait for this functionality.
Below the pivot view :


