About
This event signifies that the user process is reading a buffer into the SGA buffer cache and is waiting for a physical I/O call to return. A sequential read is a single-block read.
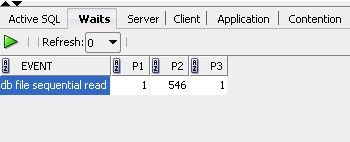
From SQL Developer, in the Monitoring Session Tools:
Single block I/Os are usually the result of using indexes. Rarely, full table scan calls could get truncated to a single block call due to extent boundaries, or buffers already present in the buffer cache. These waits would also show up as 'db file sequential read'.
Check the following VSESSION_WAIT parameter columns:
- P1 - The absolute data file number
- P2 - The block being read
- P3 - The number of blocks (should be 1)
A sequential read is usually a single-block read, although it is possible to see sequential reads for more than one block (See P3). This wait may also be seen for reads from datafile headers (P2=1 indicates a file header read) .
Articles Related
Possibly causes
Poorly tuned SQL
Investigate VSQLAREA to see whether there are SQL statements performing many disk reads.
Slow I/O system
Cross-check I/O system and VFILESTAT for poor read time.
Action
On a healthy system, physical read waits should be the biggest waits after the idle waits. However, also consider whether there are db file sequential reads on a large data warehouse that should be seeing mostly full table scans with parallel query.
Figure below depicts the differences between the following wait events:
- db file sequential read (single block read into one SGA buffer)
- db file scattered read (multiblock read into many discontinuous SGA buffers)
- direct read (single or multiblock read into the PGA, bypassing the SGA)


