About
There are several ways to monitor parallel execution. This section discusses various options.
Articles Related
Data Dictionary
The (G)V$ parallel execution views
Specific parallel execution performance views start with:
- (G)V_PQ and
- (G)V_PX.
While:
- the V$ views give you an instance-specific view,
- the GV$ views are useful in a Real Application Cluster (RAC) environment to extract cluster-wide information.
(The GV$ view contains only the instance ID as additional column compared to the Vview.)
Example
Parallel execution activity across a cluster
select inst_id
, status
, count(1) px_servers#
from gv$px_process
group by inst_id, status
order by inst_id, status ;
INST_ID STATUS PX_SERVERS#
---------- --------- -----------
1 AVAILABLE 4
1 IN USE 12
2 AVAILABLE 8
2 IN USE 8
3 AVAILABLE 6
3 IN USE 10
4 AVAILABLE 2
4 IN USE 14
Parallel Process Detail met DOP
SELECT DECODE(px.qcinst_id, NULL, username, ' – ' || lower(SUBSTR(pp.SERVER_NAME, LENGTH(pp.SERVER_NAME)-4,4) ) ) "Username",
 DECODE(px.qcinst_id,NULL, 'QC', '(Slave)') "QC/Slave",
 TO_CHAR( px.server_set) "SlaveSet",
 TO_CHAR(s.sid) "SID",
 TO_CHAR(px.inst_id) "Slave INST",
 DECODE(sw.state,'WAITING', 'WAIT', 'NOT WAIT' ) AS STATE,
  CASE sw.state
    WHEN 'WAITING'
    THEN SUBSTR(sw.event,1,30)
    ELSE NULL
  END AS wait_event,
  DECODE(px.qcinst_id, NULL ,TO_CHAR(s.sid) ,px.qcsid) "QC SID",
  TO_CHAR(px.qcinst_id) "QC INST",
  px.req_degree "Req. DOP",
  px.degree "Actual DOP"
FROM gv$px_session px,
  gv$session s ,
  gv$px_process pp,
  gv$session_wait sw
WHERE px.sid   =s.sid (+)
AND px.serial# =s.serial#(+)
AND px.inst_id = s.inst_id(+)
AND px.sid     = pp.sid (+)
AND px.serial# =pp.serial#(+)
AND sw.sid     = s.sid
AND sw.inst_id = s.inst_id
ORDER BY DECODE(px.QCINST_ID, NULL, px.INST_ID, px.QCINST_ID),
  px.QCSID,
  DECODE(px.SERVER_GROUP, NULL, 0, px.SERVER_GROUP),
  px.SERVER_SET,
  px.INST_ID,
  pp.SERVER_NAME
Execution Plan
Starting with Oracle Database 10g, for a given query there is a single cursor that is executed by all parallel servers.
All parallel execution information is in the single execution plan that is used by every parallel server process.
The basic plan information will be the same for all these mechanisms, so we will discuss how to identify and interpret the most fundamental parallel execution optimization, namely a partition-wise join.
Monitoring PARALLEL DML Executions
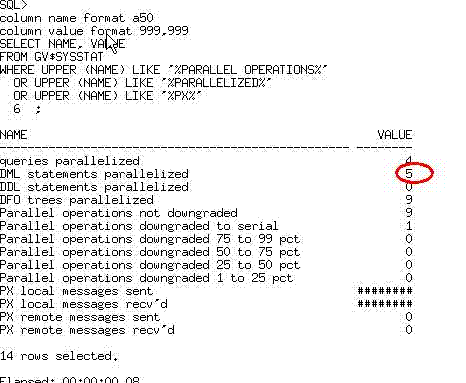
Check that you are running mapping in parallel mode by executing the following SQL statement to count the executed “Parallel DML/Query” statement
column name format a50
column value format 999,999
SELECT NAME, VALUE
FROM GV$SYSSTAT
WHERE UPPER (NAME) LIKE '%PARALLEL OPERATIONS%'
  OR UPPER (NAME) LIKE '%PARALLELIZED%'
  OR UPPER (NAME) LIKE '%PX%'
;
If you are running procedure/package/mapping in parallel mode, you should see “DML statements parallelized ” increased by 1 every time the mapping was invoked. If not you do not see this increase, then the procedure/package/mapping was not invoked as “parallel DML”.
If you see “queries parallelized” increased by 1 (one) instead, then typically it means that the SELECT statement inside of the INSERT was parallelized but that INSERT itself was not.

